Reality & contribution
One of the most important properties of epidemics is their spatial spread, a characteristic which mainly depends on the epidemic mechanism and human mobility. In this study, we are developing a geospatial and spatio-statistical analysis of the geographic dimension of the 2019 coronavirus disease pandemic (COVID-19) in New York state. The restrictions put in place to limit the diffusion and impacts of Covid-19 have had a widespread impact on people’s lives.
The aim of this study is to investigate a geographic and geospatial analysis to understand the locations and distribution patterns of COVID-19 in order to be able to define and segment the zones of contagion. The study seeks to highlight the mobility dynamics of the urban population as the process of leaving from home, traveling to and from the activity locations, and engaging in activities the urban transportation system may alter the fundamental dynamics of the infectious disease, change the number of secondary infections, promote the synchronization of the disease across the city, and affect the peak of the disease outbreaks.
Click here to see presentation of the project : Segmentation of contagion zones in New York State. The dataset contains all necessary variables that can explaine the speed up of thr spread of the virus:. Data will be obtained from : US Zip Code Latitude and Longitude, Foursquare location data, Statistical data on the COVID19 situation in each city.
Dimension & analysis
We propose a cluster-based analysis to identify and measure the level of dangerousness in each county. We collect and preprocess the necessary variables that can explain the acceleration in the spread of the virus.
To do this, we apply webscraping to extract features in the dimensions of time, region and disease. Additionally, we query geographic information for each county using Foursquare location data.
Based on these characteristics, we perform a k-means grouping and analyze the results for each dimension. Click here to visualize a Jupyter notebook : Notebook_NY
K-Means & Region-Based Clustering
A clustering-based approach can be used to solve the problems. Clustering involves grouping of similar elements of a given set of elements. By analyzing the clusters, we discover common or discriminative factors among the clusters that are likely to explore whether clusters of contacts could better explain the transmission of infectious diseases.
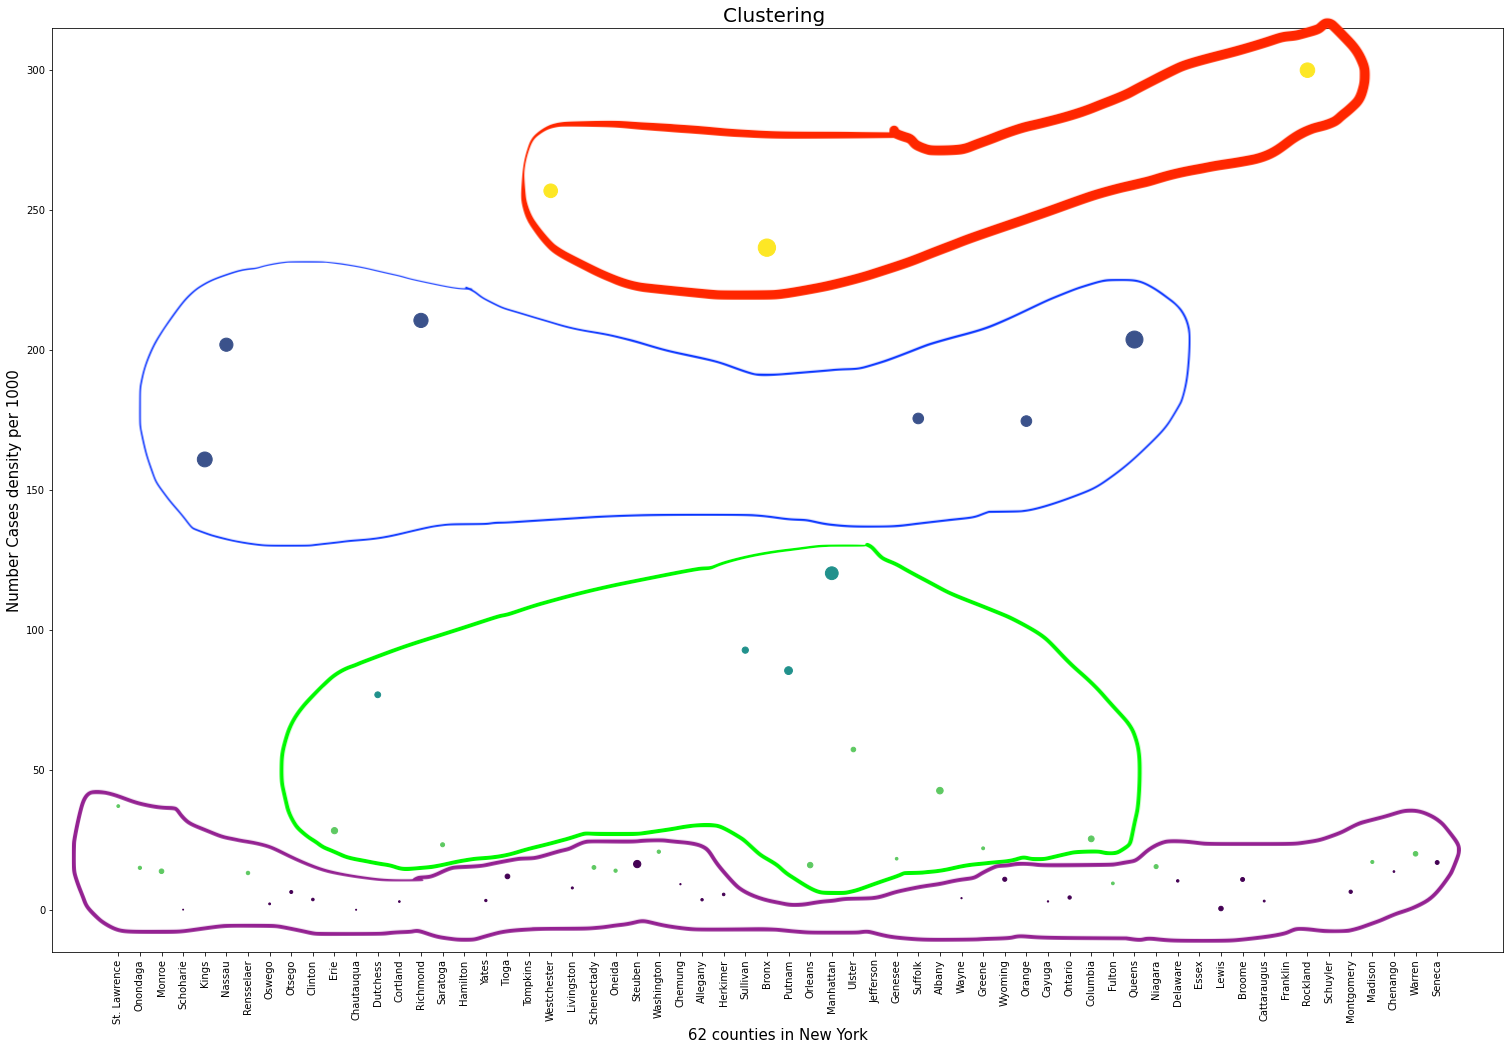
The results of clustering are highly dependent on the features used. The result reveals that 5 region clusters were created from 62 counties, represented using different colors. Generally, geographically adjacent regions were more likely to be grouped into the same cluster. This result is consistent with previous studies. However, we did not find significant differences between clusters, unlike the disease-based clusters or time-based clusters. That is, the difference in the occurrence of infectious diseases was too small to separate into clusters.


